How to Use Wireshark for Packet Capture and Protocol Analysis

World’s foremost and widely-used network protocol analyzer
Wireshark is a free and open source network packet analyzer and also known as Ethereal. A network packet analyzer helps to capture network packets and display that packet data as detailed as possible. Wireshark has different features such as filters, color coding, which help you to troubleshoot network problems as well as to develop and test software. It is the world’s foremost and widely-used network protocol analyzer. It lets you see what is happening on your network at a deep level. It is mainly used by many commercial and non-profit enterprises, government agencies and educational institutions.
Here, we will provide you some easy steps to Capture, Filter and Inspect data packets.
1. Download and Install Wireshark
You can download Wireshark at free of cost for both Windows and Mac from their official website. It is available in package repositories for Linux and other UNIX users.
2. Capture Data Packets
When you first launch Wireshark, one screen will appear containing a list of available network connections with an EKG-style line graph that represents live traffic on that respective network on your current device such as Bluetooth Network Connection, Ethernet, Virtual Box Host-Only Network and Wi-Fi. You can start data capturing by double-clicking on the name of the network from interface.

You may also begin packet capturing using any of the following shortcuts.
- Keyboard: Press Ctrl + E
- Mouse: To start capturing packets from one specific network, simply double-click on its name
- Toolbar: Click on the blue shark fin button, located on the far left-hand side of the Wireshark toolbar
The live capture process will start, all the recorded data will be displayed in the Wireshark window.
You may stop this process using any of the following steps.
- Keyboard: Press Ctrl + E
- Toolbar: Click on the red stop button, located next to the shark fin on the Wireshark toolbar
3. Color Coding
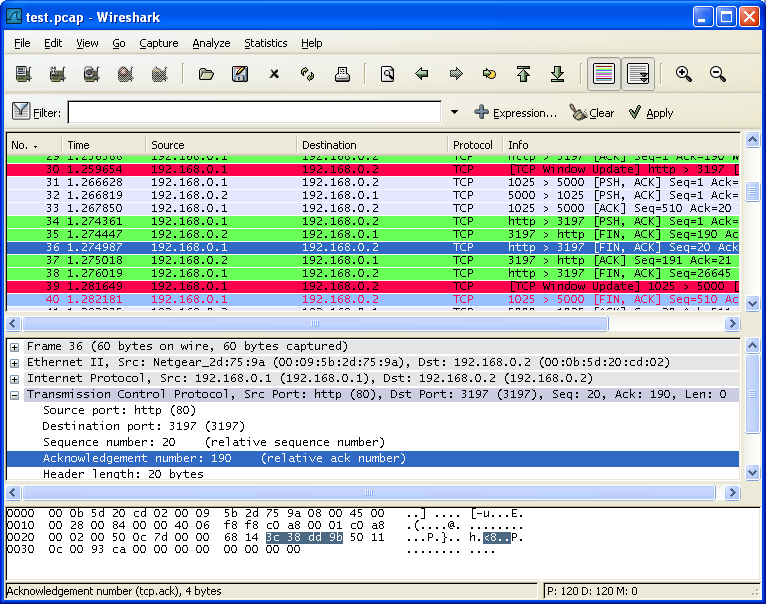
This colorization functionality helps to distinguish between different packet types based on their individual shade. You can easily identify data packets in network traffic.

Some of them have default colors:
- Light Purple color for TCP traffic
- Light Blue color for UDP traffic
- Black color identifies packets with errors – example they could have been delivered out of order.
To view the description of color codes, click view and go to Coloring Rules. Coloring rules can also be customized and modified.
4. Sample Captures
If you don’t have any network to inspect you can pick any sample from Wireshark wiki to start data capturing, you can load the file by clicking on it and then open in Wireshark. Browse for the downloaded file and select to open it.
Your own captured data can be viewed in Wireshark. You can save your own captures to access them later by clicking on file and then save it.
5. Filter Data Packets
Wireshark has two filtering languages, one is used while capturing packets and another one is used while displaying packets. Display filters allow you to focus on the packets you are interested in while hiding the currently uninteresting ones. They allow you to select packets by protocol, fields, value of the fields, comparison between fields and more.
Wireshark provides a simple but powerful display filter language that allows you to build quite complex filter expressions. You can compare values in packets as well as combine expressions into more specific expressions. You can read more about filter expressions from Wireshark’s official documentation .
6. Inspect Packets
You need to select the specific packet to view its details. If you want you may also create filter from here. Right-click on one of any details from the menu select Apply as Filter drop-down menu so filter based on it can be created.

Wireshark is the most effective tool that helps people in finding and fixing of all type of network errors and data traffic disruptions.


What other's say