How to embed tables, charts and slides in Google Docs
Google is continuously trying to add more features in Google Drive to compete with Microsoft office. Few months back, Google updated Google Docs to add new guides and rulers to embed tables, charts, slides and more. The best thing about Google Docs is that it saves all your changes over the cloud . Moreover, you may keep your slides formatted well and identically across the entire presentation. You may place guidelines horizontally and vertically in to Google Docs and easily align text and objects within a slide. Let’s learn how to insert tables, charts and slides in Google Docs.
To embed tables into Google Docs
- Open a document in Google Docs on your computer.
- Click where you want to add table and then click “Insert” and “Table” to select the cells you want to put in Docs or Slides.
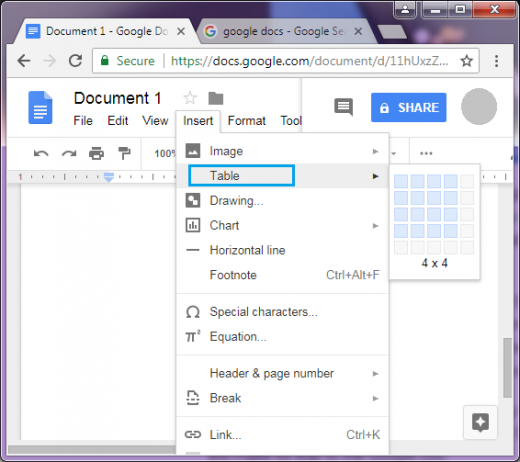
- Then click on the “Blue page” icon on the left top corner to save the changes you made.
To embed charts into Google Docs
- Open a document or presentation in Google Docs or Google Slides on your computer.
- Click Insert> Chart> From Sheets.
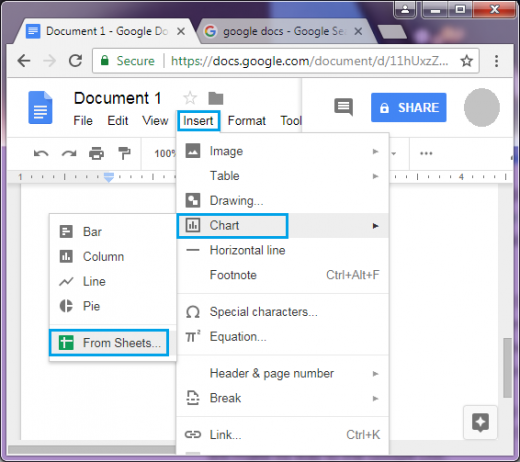
- Click on the spreadsheet with the chart you want to add, then click Select.
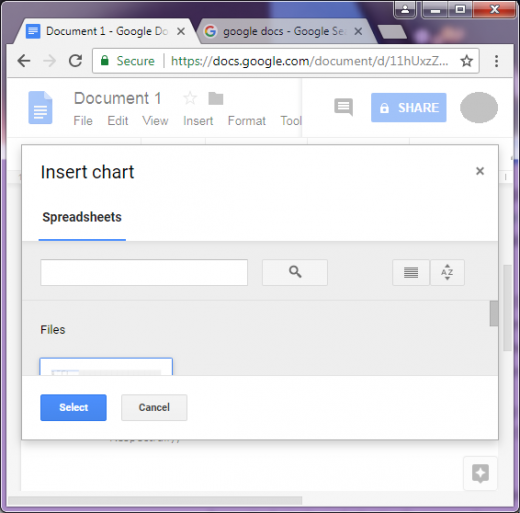
- Click on the chart you want to add.
If you don’t want to link the chart to the spreadsheet, uncheck “Link to spreadsheet.”
- Click “Import.”

To embed Slides into Google Docs
- Open a presentation in Google Docs or Google Slides on your computer.
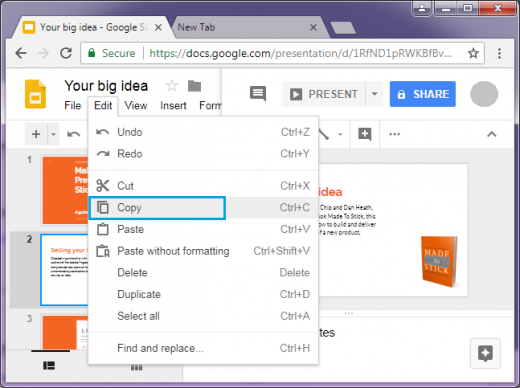
- Choose the slides you want to embed.
- Click “Edit” and “Copy” on the top of the page.
- Open another presentation in Google Docs or Google Slides where you want to embed these slides.
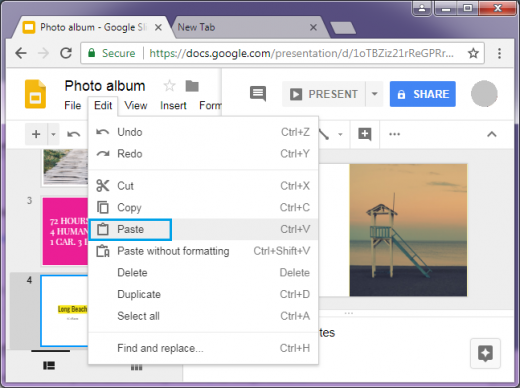
- On the left, click the slide where you want to add them.
- Click “Edit” and “Paste” on the top.
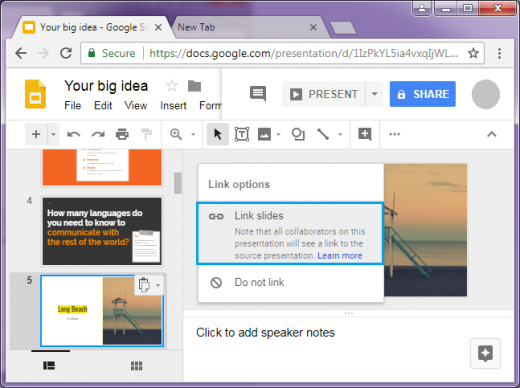
- Click “Link slides” under link options.
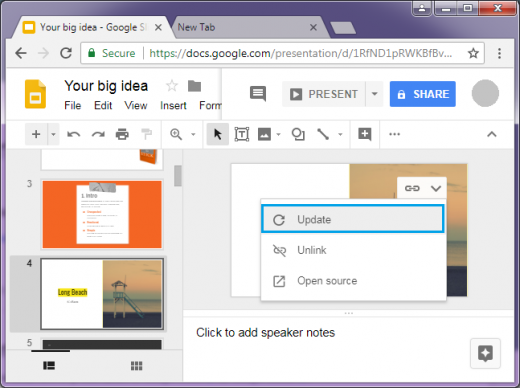
- Click “Update” to sync the Google Doc with the changes you made in the source slide.


What other's say